Local Storage seems to be disabled in your browser.
For the best experience on our site, be sure to turn on Local Storage in your browser.
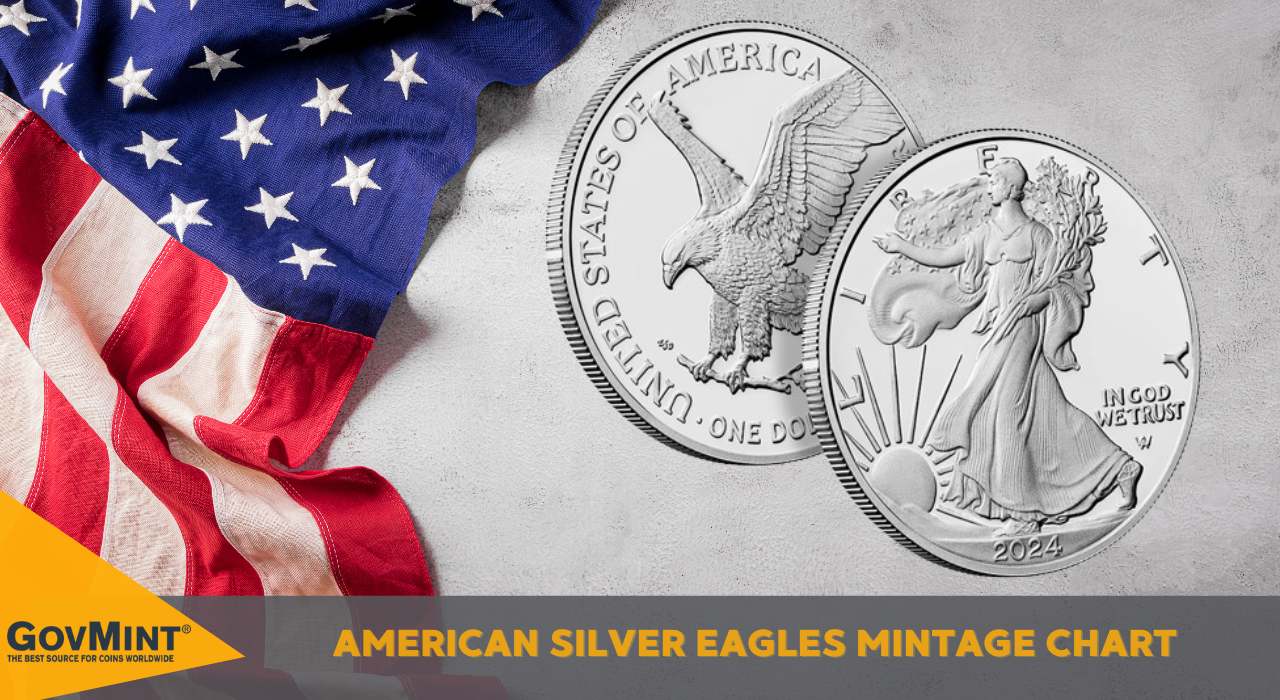
Silver Eagles Mintage Chart
By GovMint :
Our Silver Eagle mintage charts are indispensable tools for collectors and enthusiasts of the American Silver Eagle series, which has been an iconic presence in the coin-collecting world since its inception in 1986. Our Silver Eagle mintage charts detail mint state and proof releases, including bullion, burnished, and proof versions, across all years from 1986 to 2024, offering a detailed view of mintages for each issue. While ungraded bullion versions of the Silver Eagle can be traded for their silver content, graded options, as well as collector versions, tend to be sought after by collectors for their condition and mintage, making this chart a crucial resource for anyone looking to deepen their understanding or complete their collection of these treasured coins.
Charts Accurate as of 4/15/2025
Mint State American Silver Eagles Mintages By Year
| Year | $1 |
|---|---|
| 1986 | 5,393,005 |
| 1987 | 11,442,335 |
| 1988 | 5,004,646 |
| 1989 | 5,203,327 |
| 1990 | 5,840,110 |
| 1991 | 7,191,066 |
| 1992 | 5,540,068 |
| 1993 | 6,763,762 |
| 1994 | 4,227,319 |
| 1995 | 4,672,051 |
| 1996 | 3,603,386 |
| 1997 | 4,295,004 |
| 1998 | 4,847,547 |
| 1999 | 7,408,640 |
| 2000 | 9,239,132 |
| 2001 | 9,001,711 |
| 2002 | 10,539,026 |
| 2003 | 8,495,008 |
| 2004 | 8,882,754 |
| 2005 | 8,891,025 |
| 2006 | 10,676,522 |
| 2006 W Burnished | 466,573 |
| 2007 | 9,028,036 |
| 2007 W Burnished | 690,891 |
| 2008 | 20,583,000 |
| 2008 W Burnished* | 535,000 |
| 2008-W Reverse of 2007 Burnished* | 46,318 |
| 2009 | 30,459,500 |
| 2010 | 34,764,500 |
| 2011 | 40,020,000 |
| 2011-S | 99,982 |
| 2011-W Burnished | 409,866 |
| 2012 | 37,996,000 |
| 2012-W | 226,397 |
| 2013 | 42,675,000 |
| 2013-W | 221,985 |
| 2013-W (enhanced) | 234,504 |
| 2014 | 54,151,500 |
| 2014-W | 253,169 |
| 2015 | 47,000,000 |
| 2015-W | 223,879 |
| 2016 | 37,701,500 |
| 2016-W | 216,501 |
| 2017 | 18,065,500 |
| 2017-W | 176,739 |
| 2018 | 15,700,000 |
| 2018-W | 138,947 |
| 2019 | 14,863,500 |
| 2019-W | 138,390 |
| 2020 | 30,089,500 |
| 2020-W | 154,864 |
| 2021 Type 1 Philadelphia Mint | 495,500 |
| 2021 Type 1 San Francisco Mint | 11,811,000 |
| 2021 Type 1 West Point Mint | 1,000,000 |
| 2021 Type 2 San Francisco Mint | 1,000,000 |
| 2021 Type 2 West Point Mint | 13,968,500 |
| 2021-W | 187,893 |
| 2022 | 16,000,000 |
| 2022-W* | 212,997 |
| 2023 | 24,750,000 |
| 2023-W* | 163,902 |
| 2024* | 24,862,000 |
| 2024-W* | 113,787 |
| 2025 | TBD |
| 2025-W | TBD |
Proof American Silver Eagles Mintages By Year
| Year | $1 |
|---|---|
| 1986-S | 1,446,778 |
| 1987-S | 904,732 |
| 1988-S | 557,370 |
| 1989-S | 617,694 |
| 1990-S | 695,510 |
| 1991-S | 511,924 |
| 1992-S | 498,543 |
| 1993-P | 405,913 |
| 1994-P | 372,168 |
| 1995-P | 407,822 |
| 1995-W | 30,102 |
| 1996-P | 498,293 |
| 1997-P | 440,315 |
| 1998-P | 450,728 |
| 1999-P | 549,330 |
| 2000-P | 600,743 |
| 2001-W | 746,398 |
| 2002-W | 647,342 |
| 2003-W | 747,831 |
| 2004-W | 801,602 |
| 2005-W | 816,663 |
| 2006-W | 1,092,475 |
| 2006 Reverse Proof | 248,875 |
| 2007-W | 821,759 |
| 2008-W | 700,979 |
| 2009-W | N/A |
| 2010-W | 849,861 |
| 2011-W | 947,454 |
| 2011 Reverse Proof | 99,981 |
| 2012-W | 882,260 |
| 2012-S | 285,114 |
| 2012-S Rev. Proof | 224,911 |
| 2013-W | 869,253 |
| 2013-W Rev. Proof | 234,504 |
| 2014-W | 944,757 |
| 2015-W | 707,518 |
| 2016-W | 595,843 |
| 2017-W | 440,596 |
| 2017-S | 123,799 |
| 2018-W | 411,512 |
| 2018-S | 158,791 |
| 2019-W | 375,180 |
| 2019-S | 199,619 |
| 2019-W Enhanced Rev. Proof | 99,675 |
| 2019-S Enhanced Rev Proof | 29,910 |
| 2020-W | 381,112 |
| 2020-S | 208,871 |
| 2020-W V75 75th-anniversary end of WWII | 74,743 |
| 2021-W Type 1* | 417,187 |
| 2021-W Type 2* | 385,777 |
| 2021-S* | 275,676 |
| 2021 2-Coin Reverse Proof Set* | 124,916 |
| 2022-W* | 693,544 |
| 2022-S* | 366, 428 |
| 2023-W* | 560,496 |
| 2023-S* | 242,356 |
| 2024-W* | 373,083 |
| 2024-S* | 181,067 |
| 2025-W | TBD |
| 2025-S | TBD |
How Many Silver American Eagles Are Minted Each Year?
There is no standard set of mintages for American Silver Eagles that is followed consistently year after year. Each year, and each issue within that year, will have its own unique mintage. Typically, bullion Silver Eagles are produced in the highest amounts, often in the millions, while proof and burnished varieties, geared towards collectors, tend to be issued in smaller numbers. To stay up to date on both past and current Silver Eagle mintages, we recommended bookmarking our Silver Eagle mintage charts above.
What Is the Lowest Mintage Year for Silver Eagles?
To date, the lowest mintage year for the bullion American Silver Eagle was 1996, with a total mintage of approximately 3.6 million coins. This relatively low mintage, compared to other years, has made the 1996 Silver Eagle a key date coin for collectors. However, it's important to note that mintage figures can vary between bullion, proof, and burnished versions of the Silver Eagle coins, with bullion coins tending to have the highest mintage when compared to the collector versions. For example, the lowest mintage Proof Silver Eagle to date is the 1995-W Proof Silver Eagle which had a final mintage of just 30,125 pieces. New releases or updated figures could change this status. Our Silver Eagle mintage charts are essential resources for any collector to track accurate mintages.
© 2024 Copyright GovMint.com. All Rights Reserved. GovMint.com does not sell coins and numismatics as investments, but rather as collectibles. Please review GovMint's Terms and Conditions, Terms of Use and Privacy Policy before using this website and prior to purchasing from GovMint.com.
Related Products